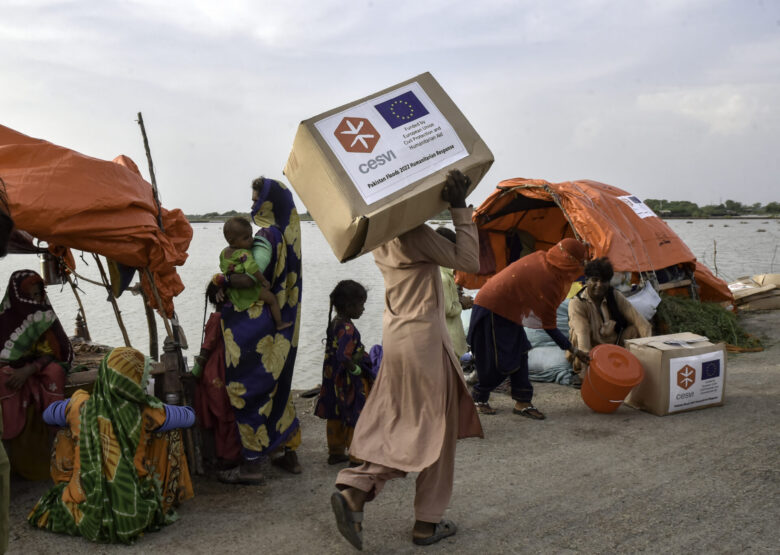
In February 2021, the socioeconomic situations of Nepal, Bangladesh, and Laos were assessed, and their “graduation” from the United Nations’ “Least Developed Countries (LDC)” category was recommended. This was a decision by the UN Committee for Development Policy (※1), and after a five-year preparatory period, the three countries are scheduled to graduate from the “Least Developed Country” category in 2026. In another classification set by the World Bank, these three countries have already been upgraded from “low-income countries” to “lower-middle-income countries.” At first glance, this can be taken as evidence of escaping poverty and making progress in “development,” but according to the World Bank’s own data, more than half of the populations of Nepal and Bangladesh (51% and 52%, respectively) live on less than US$100 per month, which can be regarded as an extremely severe state of poverty. In Laos, 37% of the population is in the same situation.
Various terms are used to classify the socioeconomic status of countries, such as “developing” and “developed” countries, and “low-, middle-, and high-income countries.” These classifications, or the labels attached to them, can be said to shape our image of the degree of poverty in countries around the world. But what do these classifications actually mean? And to what extent do they capture the issues of poverty and inequality that the world faces? This article explores the problems hidden in the various methods of classifying the scales of poverty.
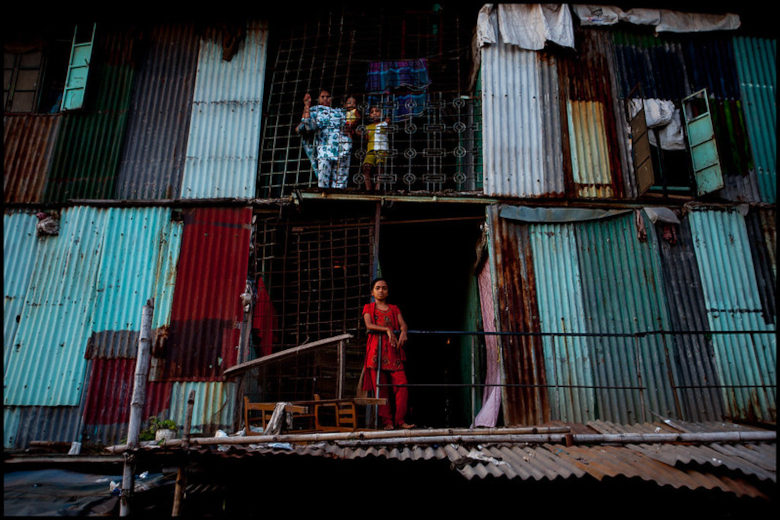
Low-income apartment building, Bangladesh (Photo: Zoriah / Flickr [CC BY-NC 2.0])
目次
“Graduation” from poverty?
As of 2021, 46 countries worldwide are classified by the UN as “Least Developed Countries,” 33 of which are in Sub-Saharan Africa. So, by what criteria does a country become an LDC, and how does it graduate? There are three criteria for graduation from LDC status, and once certain levels are surpassed, graduation is decided. One of those criteria is Gross National Income (GNI) per capita (the other two conditions are introduced below). In other words, it is the income earned by a country’s citizens domestically and abroad. However, the GNI threshold for graduation from LDC status can hardly be called high. As of 2021, the threshold set for GNI is US$1,222 or more per person per year. This amounts to roughly US$100 per month.
The World Bank’s classification of countries into low-, middle-, and high-income is also determined by per capita GNI per year. But as with graduation from LDC status, the income levels required to be upgraded to “middle-income” are very low. The term “middle-income country” might make one imagine a state where poverty is not rampant, even if the country is not wealthy. However, the reality is different from that image. As of 2021, if a country’s per capita GNI exceeds US$1,046 per year, it becomes a lower-middle-income country, and if it exceeds US$4,096, it is considered an upper-middle-income country. Furthermore, clearing US$12,695 makes a country high-income. Converted to a monthly basis, exceeding an average of US$87—barely enough for even the most basic living—puts a country into the middle-income category, and US$1,058 into the high-income category.
Hans Rosling, author of the book Factfulness, which argues that many of the world’s problems are being resolved, uses these World Bank classifications to argue that the majority of the world’s people live in middle-income countries and are neither poor nor rich, but somewhere in between. He even asserted that the gap between Western countries and the rest, and between the rich and the not-so-rich, no longer exists (※2).
However, both the way the data is presented and the conclusions drawn from it must be said to be highly misleading. As noted above, in the World Bank’s standards the income level set for becoming a “middle-income country” is far too low, and there is also a major problem with the graph used to support the claim. It uses per capita GDP (Gross Domestic Product) and life expectancy as axes, but the GDP scale increases not evenly, but by multiples. Looking at the graph in left and right halves, in the left half the GDP scale only increases from 0 to US$5,000, while in the right half it increases from US$5,000 to US$200,000 (※3). As a result, it appears as though per capita GDP gradually increases across countries in a gentle gradient, but that is not the case. Using the same data and simply spacing the per capita GDP scale evenly produces a graph like the one below (press play to see 30 years of changes from 1986 to 2015).
Viewed this way, the disparities between countries are obvious at a glance. It becomes clear that there are large gaps between groups: countries such as those in Africa and India, where per capita GDP remains around US$1,000 to US$2,000; countries such as China, Brazil, and Mexico, which have grown to around US$10,000; and Western countries and Japan, where it is US$30,000 to US$60,000. Although GDP and life expectancy have increased in most countries over the last 30 years, it can be said that the situation in countries with remarkably low GDP (especially Sub-Saharan Africa) has improved very slowly compared with other regions. Meanwhile, those with the largest movement from the left to the right of the graph—i.e., the fastest growth—are the Western countries and Japan that already had high GDP, widening the income gap with most other countries. Additionally, the rapid GDP growth exceeding US$80,000 in Switzerland, Liechtenstein, Luxembourg, the Channel Islands (UK), and Bermuda (UK)—which have systems that quietly promote the concentration of wealth in tax havens—also stands out. What this shows is that, by per-country per capita GDP, global inequality is extremely large and widening.
Thinking about poverty in terms of income levels
However, per capita GDP or GNI alone does not reveal the realities of the world’s economy or poverty. Two issues can be raised. First, these indicators are merely averages obtained by dividing a country’s total production/income by its population, and cannot be read to reflect severe inequalities within a country. Also, because they average across countries, they may allow for some cross-country comparison but are not suitable for grasping the overall global picture. Second, GDP and GNI only count things to which monetary value is attached, and thus do not sufficiently capture the realities of the economy and society. For example, financial movements due to speculation, which are not necessarily meaningful (or are even harmful) to the economy, are counted, but the value of child-rearing and household labor—indispensable for social and economic growth—is not. Nor are damages from pollution and environmental destruction caused by manufacturing taken into account.
In light of the first issue, to capture the actual situation of people living in poverty worldwide, we can count those living below a certain income. When comparing the entire world’s population, US dollars are used as the unit, but purchasing power varies by country because prices differ. Therefore, a figure adjusted to local price levels in each country/region (purchasing power parity: PPP) is used. For example, it is calculated such that the amount of grain that can be bought with an adjusted US$1 (PPP) is the same no matter which country it is purchased in. Although data is often lacking and it is by no means a perfect system, the US dollar value can be treated as roughly equivalent in value whether in low-price low-income countries or high-price high-income countries.
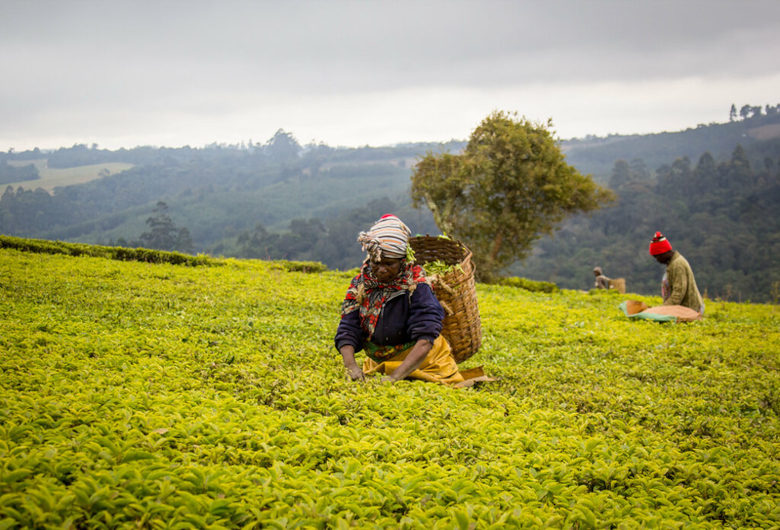
Tea plantation, Tanzania (Photo: CIFOR / Flickr [CC BY-NC-ND 2.0])
Even after unifying values with adjusted dollars, a further problem arises: where to draw the line between poverty and non-poverty. Since 2015, the World Bank has defined people living on US$1.90 or less per day as being in extreme poverty. This line, set at US$1 in 1990 and then gradually raised to match inflation, was originally determined as the average of poverty lines set in 15 low-income countries.
The UN Sustainable Development Goals (SDGs) also use this figure, setting as one target the eradication of extreme poverty by 2030. In other words, the goal is to reduce to zero the number of people living on US$1.90 or less per day. Although there is no prospect of achieving this goal at present, it is obvious that crossing the threshold of US$1.90 per day (less than US$60 per month) does not mean one has escaped extreme poverty. As noted, because this amount is adjusted by PPP, it can be thought of in a country like Japan as well. That is, after converting rent, utilities, food, medical expenses, clothing, etc., it can be read as saying that spending around 6,000 yen per month would mean one is not in extreme poverty. Some have pointed out that this highly unrealistic poverty line continues to be used because if it were set higher, recent years would show little improvement, making it impossible to demonstrate achievements in poverty reduction.
Has “extreme poverty” improved?
In addition to the extreme poverty line of US$1.90 per day, the World Bank has set the lower line of “lower-middle-income countries” at US$3.20 per day, and “upper-middle-income countries” at US$5.50 per day. So how many people live at these income levels? The graph below divides the world’s population into these categories and shows the trend from 1981 to 2017.
Viewed at the global level, the number of people living on US$1.90 has indeed fallen sharply over the 36 years shown. Limiting ourselves to incomes below US$10 per day, it is not wrong to say that the overall degree of global poverty has improved. However, this graph shows proportions of the world’s total population, and the degree of improvement varies greatly by region. In particular, poverty reduction due to China’s rapid economic growth accounts for much of this improvement. So how much improvement has been seen in regions where poverty is still widespread? The graph below focuses on Sub-Saharan Africa and shows the proportion of the population, based on the same categories and the same data, for the period from 1990 to 2018 (※4).
In Sub-Saharan Africa, there has certainly been some improvement at the US$1.90 line, decreasing from 55% to 40% of the total population over about 30 years. However, improvements in the other categories are extremely gradual—far from what could be called substantial improvement. Attention also needs to be paid to the overall low income levels. Not only is the number of people living in the most severe state of extreme poverty (US$1.90 per day) in Sub-Saharan Africa (40% of the population) at a crisis level, but if we include those living on US$5.50 per day or less, the figure rises to 86%.
In the first place, can the realities of global poverty and inequality be captured by such low income benchmarks? Even if one reaches US$5.50 per day (about US$170 per month) or US$10 per day (about US$310 per month), how feasible is daily life? In response to these benchmarks—whose bases do not necessarily match reality—some researchers have proposed an “ethical (moral) poverty line.” The benchmark is the relationship between life expectancy and income, identifying the point at which survival rates drop sharply as disposable income declines. In other words, while the extreme poverty line and other benchmarks set by the World Bank are calculated from poverty lines in multiple countries, the ethical poverty line sets the minimum based on whether survival can be guaranteed. In that sense, it can be regarded as an objective and reasonable extreme poverty line because it is based on “being able to live.” As of 2015, that line was estimated at US$7.40 per day. According to the World Bank’s 2014 data, more than half of the world’s population (56.8%) lived below this income level.
There is also the concept/method of a “basic needs basket” for calculating a minimum poverty line. This lists and totals the minimum necessary expenditures for living—such as food, clothing, and housing—tailored to a specific country or region and its living environment. It takes into account not just price differences between countries, but also rural–urban differences, and the ways that necessities and their prices vary with living habits and culture.
While extreme poverty (absolute poverty) is closely tied to life and death, relative poverty (※5) is also sufficiently distressing. As of 2013, the poverty line in the United States, a high-income country, was set at an annual income of US$23,600 or less for a family of four, which translates to US$5,900 per person. Yet, according to data from the same year, only about 20% of the world’s population reached that income level. The same data shows that an annual income per person above US$14,500 (US$1,208 per month) places one in the top 10% of the global income distribution. Moreover, when looking at people’s situations not only by income but also by wealth, global inequality becomes even more pronounced.
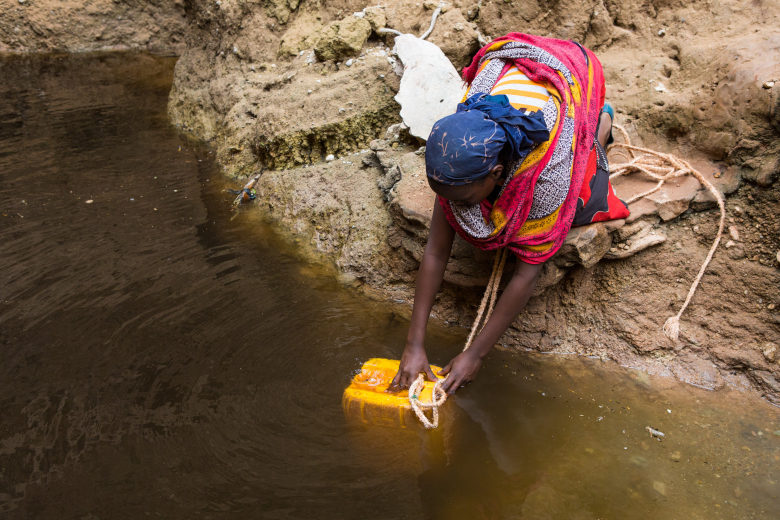
Woman drawing water, Ethiopia (Photo: Martchan / Shutterstock.com)
It’s not just about money
So far we have mainly considered poverty from the perspective of people’s income. While this is an important indicator for thinking about poverty, “money” alone cannot capture it. The forms that “poverty” takes vary greatly depending on place and situation. In considering poverty, we need to look not only at the presence of food, clothing, and shelter, but also at air and water quality, and the state of health care and education. For that, people’s circumstances depend not only on personal income but also on welfare systems provided by governments and other support structures. Poverty as seen by a farmer practicing subsistence living with little cash is different from that seen by an unemployed person living in a low-income urban neighborhood. It also differs according to gender, age, disability status, health, and access to education. There are many aspects that only those in that situation can understand. Poverty that manifests in various forms is called “multidimensional poverty.”
Given this reality, to capture poverty more comprehensively, the University of Oxford and the United Nations Development Programme (UNDP) created the Multidimensional Poverty Index (MPI), which quantifies poverty across three dimensions: health, education, and standard of living. In its 2021 report, in 43 out of 60 countries studied, the number of people in multidimensional poverty exceeded the number of people living on US$1.90 per day or less. The Human Development Index (HDI) created by the UNDP also uses the same three dimensions to measure the degree of human development from multiple perspectives.
Also, in the LDC category mentioned at the beginning, the UN Committee for Development Policy uses non-monetary indicators in addition to GNI as criteria for graduation. It has established a human assets index related to health care and education, and an economic and environmental vulnerability index that reflects economic instability and the risk of natural disasters, among others, to evaluate each country’s development level.
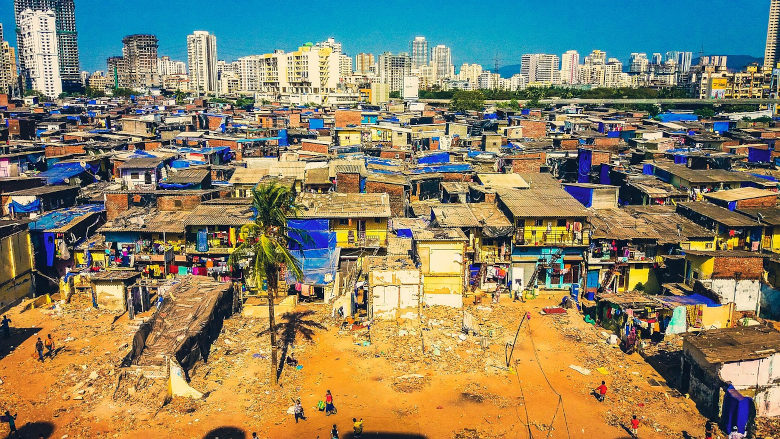
Mumbai, India (Photo: Max Pixel)
Facing the realities of poverty
It would be problematic to hold an excessively negative image of the world that does not reflect reality. In fact, from various perspectives, the world is becoming a better place. Through steady efforts such as vaccination programs around the world, the under-five mortality rate has fallen dramatically over the past few decades. Deaths from diseases such as malaria have also fallen significantly. Even the most severe levels of extreme poverty have improved somewhat.
However, the reality of global poverty remains extremely serious and can by no means be viewed optimistically. Measured against realistic benchmarks, half of the world’s population is in a state of extreme poverty. There is a large gap between people and countries in poverty and those who are wealthy. Furthermore, looking at the two categories that make up the world—low-income countries, which are the majority, and high-income countries, which are the minority (※6)—we can see that global inequality is not narrowing. On the contrary, the gap between low- and high-income countries is widening.
It is important to view positively and evaluate the areas where poverty is improving. Nevertheless, at present the suffering is far too great, and the pace of improvement is far too slow. While looking squarely at the realities of global poverty and inequality, we also need to reconsider the structure of the world’s economy, including issues that exacerbate them such as unfair trade, illicit financial flows, and tax havens.
※1 The UN Committee for Development Policy (Committee for Development Policy) is an advisory body under the Economic and Social Council that addresses economic, social, and environmental issues, and is composed of 24 experts.
※2 Factfulness: Ten Reasons We’re Wrong About the World – and Why Things Are Better Than You Think, London: Hodder and Stoughton, 2018, p. 27.
※3 In Factfulness (p. 98), Rosling explains this presentation by saying that as income increases, the value of that increase decreases for those who have more. However, the rate of increase is far too high, and when looking at actual amounts, it does not negate the existence of a huge gap between low- and high-income countries.
※4 In Our World in Data, the source for trends in global poverty and in Sub-Saharan Africa, data for Sub-Saharan Africa is only displayed from 1990, resulting in a difference in periods.
※5 Relative poverty refers to “a state of being poorer than the majority when compared within a country or region’s standards.”
※6 At GNV, instead of “developing” and “developed,” we use “low-income countries” and “high-income countries.” “Low-income countries” are not necessarily in the process of development; they may also be in decline. Also, “developing countries” can be taken to imply that they are in the process of catching up to “developed countries.” In this way, the term “developing countries” does not necessarily reflect reality, and can be seen as idealizing the current state of “developed countries” and placing hope in moving toward that state. For this reason, it lacks objectivity and is considered a misleading term. Note that at GNV, “low-income” and “high-income” countries are not defined by setting specific thresholds for per capita GDP or GNI. As the graph comparing GDP and life expectancy in the main text shows, there is a clear difference between high-income countries and others, and we use these terms as broad groupings.
Writer: Virgil Hawkins
Graphics: Madoka Konishi, Virgil Hawkins
![]()


ずっと読みたかったトピックを読むことができて嬉しいです。このサイトでは、「貧困」というワードそのものだけでなく、貧困に関連する記事も多く扱われていますが、漠然とした理解しか出来ていなかったように思います。この記事を読んだことで、世界の現実を知り、いまの世界(経済の中心である高所得国)がいかに楽観的で無責任であるかを知ることができました。現状をつくり出している一因である、タックスヘイブンなどについての記事も併せて拝見させていただきます。
普段ニュースで使われているキーワードに隠された現実について過去と比較してどうか、ということがグラフを用いられ解説してありわかりやすかったです。貧困問題は多角的な視点が必要だと改めて気付かされました。
世界の貧困はまだまだ大きな問題だと感じました
ファクトフルネスのように社会的に話題となったものの印象は強く残ると思う。
この記事の内容が事実として発信されても、社会で話題にならないことが残念。
貧困の実際の状況と世界銀行のような国際機関の人々の認識に大きな乖離があるなと感じた。